If you’re looking at ROAS when measuring your top of funnel ads, then I’m sorry but you’re doing it wrong.
Measuring success of your brand building, engagement ads at the top of your funnel using a last click ROAS KPI is never going to work. Reports will show very little ROAS, your CFO or board will want to pull those campaigns and then you’ll be back to square one when it comes to fueling your revenue growth. Square one being trying to sell more stock to your existing audience. And we all know by now, that strategy doesn’t work.
So how exactly should you be measuring success of these top of funnel ads. Well there’s 2 avenues you can take. One might be slightly easier to convince your board of.
Let’s take a look.
Blended ROAS
Your C-suite, investors or Founders will be financially focused. Therefore we do always need a way to tie all marketing performance back to revenue. And some marketers may think the way to do this is to dive more granularly into the data but actually, the trick is to take a very large step back and see things from a wider perspective.
Blended ROAS allows you to do this.
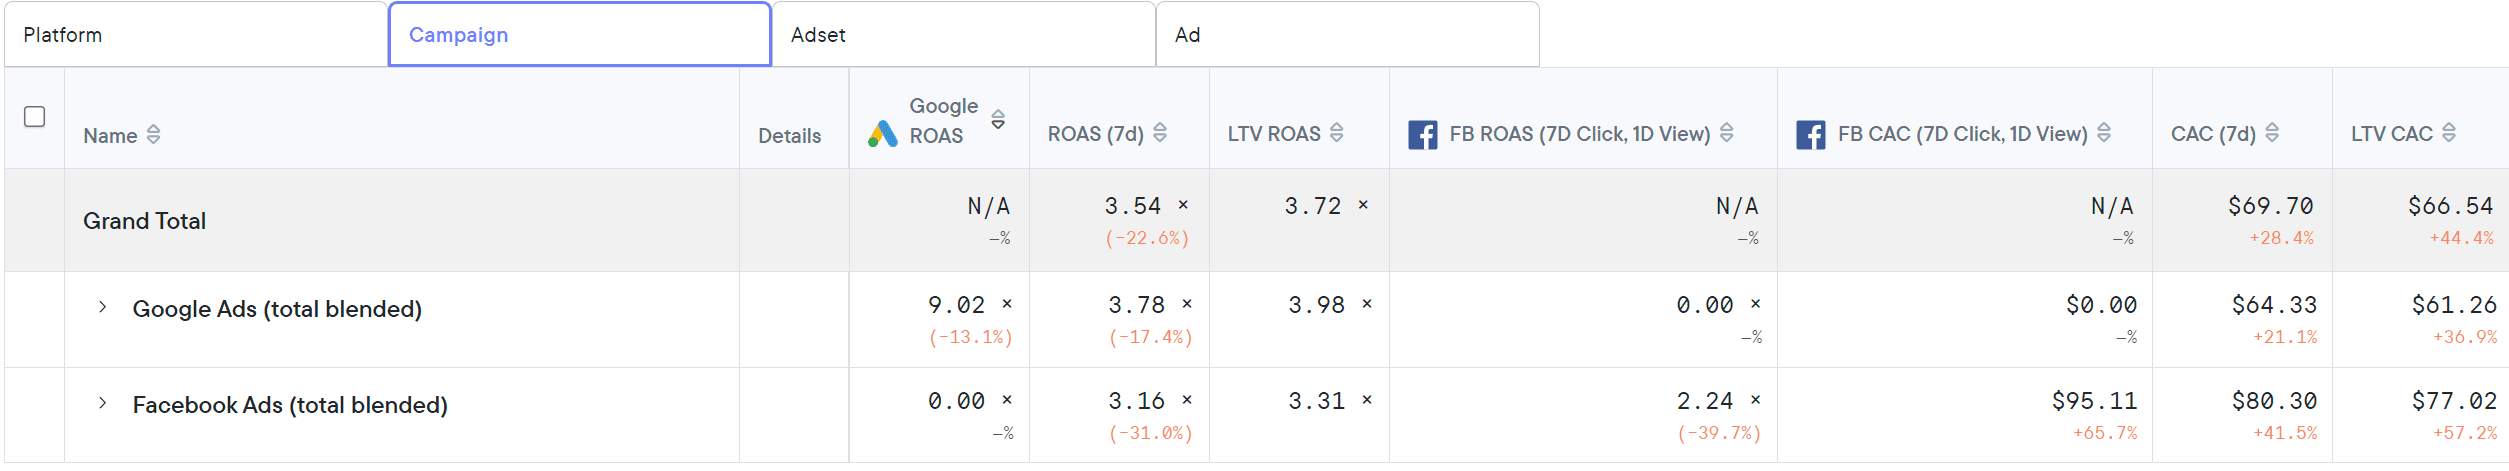
Blended ROAS means taking ALL of your marketing campaigns and calculating ROAS based on all activity. So rather than looking at ROAS on a singular campaign by campaign basis, you combine all your activity across the entire funnel and then calculate ROAS.
However, it can be tricky to accurately calculate a true blended ROAS without the use of a 3rd party attribution platform. We find that native platform analytics will often overinflate performance and contribution to conversions, especially when implementing a 7 day Last Click ROAS model.
We use Northbeam as our source of truth. It takes into account all touchpoints a consumer travels through in order to make a purchase and adjusts conversion value accordingly. This allows us to see how different channels and campaigns are influencing one another and the value that our upper funnel activity has on influencing conversions.
Engagement KPIs
If you are not able to implement a platform like Northbeam immediately (although, we would highly recommend that you do if you are serious about scaling your marketing efforts), then you’ll need to adjust your KPIs to show the value of your upper funnel activity.
Here are some example metrics that you need to be keeping an eye on.
CTR – Click Through Rate
VTR – View Through Rate
Video Played To
Brand Lift Metrics (only available on Google if have you have a Google Ad representative)
EVC – Engaged-Video Conversion
Most of these metrics will be measuring video performance. At the top of funnel, video ads are going to be the most effective way of engaging and audience so we would always recommend the majority of your upper funnel activity be video.
Click through rate.
Click through rate should be a fairly obvious metric to check. It will assess how intrigued you audience are when first being introduced to your brand. A high click through rate is a positive sign. Just make sure, if your ads are directing consumers to your website through a “Learn more” CTA etc, that your website is optimized, your landing pages are engaging and your product description pages are as informative as possible.
View Through Rate
Also known now as just View Rate is a metric seen within Youtube advertising.
View Rate = views/impressions
It helps determine how compelling your ad is and can help in optimizing your creative. A low view rate might suggest that the beginning of your ad is not compelling enough, therefore the audience isn’t sticking around to watch the rest of it. An average VTR is around 10-15% across all industries so use this as a benchmark to begin with.
Remember, individual formats of video ad have different parameters for what is considered a “view” so make sure you are clear on these when comparing VTR between campaigns.
Video Played To
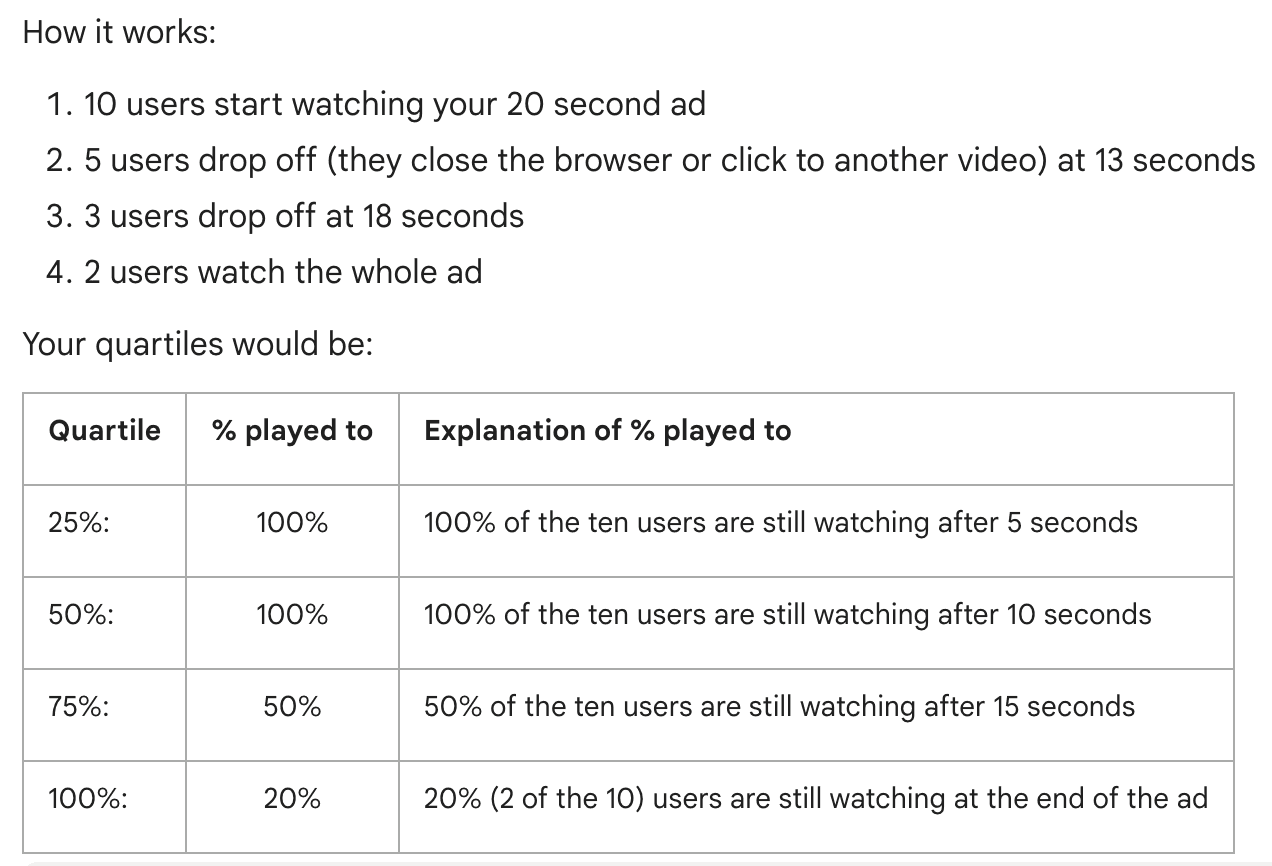
This metric measures the percentage of people who watched a certain portion of your ad (25/50/75/100%).
Again, this metric can help measure how engaging your creative is and is usually measured alongside Quartile Reporting. Google gives this example to help advertisers understand Video Played To reporting.
If you’re looking at ROAS when measuring your top of funnel ads, then I’m sorry but you’re doing it wrong.
Measuring success of your brand building, engagement ads at the top of your funnel using a last click ROAS KPI is never going to work. Reports will show very little ROAS, your CFO or board will want to pull those campaigns and then you’ll be back to square one when it comes to fueling your revenue growth. Square one being trying to sell more stock to your existing audience. And we all know by now, that strategy doesn’t work.
So how exactly should you be measuring success of these top of funnel ads. Well there’s 2 avenues you can take. One might be slightly easier to convince your board of.
Let’s take a look.
Blended ROAS
Your C-suite, investors or Founders will be financially focused. Therefore we do always need a way to tie all marketing performance back to revenue. And some marketers may think the way to do this is to dive more granularly into the data but actually, the trick is to take a very large step back and see things from a wider perspective.
Blended ROAS allows you to do this.
Blended ROAS means taking ALL of your marketing campaigns and calculating ROAS based on all activity. So rather than looking at ROAS on a singular campaign by campaign basis, you combine all your activity across the entire funnel and then calculate ROAS.
However, it can be tricky to accurately calculate a true blended ROAS without the use of a 3rd party attribution platform. We find that native platform analytics will often overinflate performance and contribution to conversions, especially when implementing a 7 day Last Click ROAS model.
We use Northbeam as our source of truth. It takes into account all touchpoints a consumer travels through in order to make a purchase and adjusts conversion value accordingly. This allows us to see how different channels and campaigns are influencing one another and the value that our upper funnel activity has on influencing conversions.
Engagement KPIs
If you are not able to implement a platform like Northbeam immediately (although, we would highly recommend that you do if you are serious about scaling your marketing efforts), then you’ll need to adjust your KPIs to show the value of your upper funnel activity.
Here are some example metrics that you need to be keeping an eye on.
CTR – Click Through Rate
VTR – View Through Rate
Video Played To
Brand Lift Metrics (only available on Google if have you have a Google Ad representative)
EVC – Engaged-Video Conversion
Most of these metrics will be measuring video performance. At the top of funnel, video ads are going to be the most effective way of engaging and audience so we would always recommend the majority of your upper funnel activity be video.
Click through rate.
Click through rate should be a fairly obvious metric to check. It will assess how intrigued you audience are when first being introduced to your brand. A high click through rate is a positive sign. Just make sure, if your ads are directing consumers to your website through a “Learn more” CTA etc, that your website is optimized, your landing pages are engaging and your product description pages are as informative as possible.
View Through Rate
Also known now as just View Rate is a metric seen within Youtube advertising.
View Rate = views/impressions
It helps determine how compelling your ad is and can help in optimizing your creative. A low view rate might suggest that the beginning of your ad is not compelling enough, therefore the audience isn’t sticking around to watch the rest of it. An average VTR is around 10-15% across all industries so use this as a benchmark to begin with.
Remember, individual formats of video ad have different parameters for what is considered a “view” so make sure you are clear on these when comparing VTR between campaigns.
Video Played To
This metric measures the percentage of people who watched a certain portion of your ad (25/50/75/100%).
Again, this metric can help measure how engaging your creative is and is usually measured alongside Quartile Reporting. Google gives this example to help advertisers understand Video Played To reporting.
Brand Lift Metrics
If you have a dedicated Google Ads representative, you can request to enable Brand Lift. Brand lift reports will show you a % lift based on an audience cohort who have been exposed to your brand.
Brand lift tests are available for in-stream and bumper ads and will request that users complete a survey that will help to measure brand lift. Surveys are shown to users who have seen your ads and users who were eligible to see your ads but didn’t see them.
To learn more about Brand Lift, Google has loads of really helpful resources. Or get in touch with us to discuss the advantages!
Engaged Video Conversions
EVCs lend themselves to the complicated purchase journey we know that users take. EVCs are counted when a user watched at least 10 seconds of a skippable ad but doesn’t click on your video. Skippable ads are skippable after 5 seconds so a user sticking around for at least 10 seconds is a positive sign that your ads are engaging, and you can get more of your brand story across.
Even though we know that video is an effective ad format, unlike other campaign types, users won’t always interact with a video. But they often will act later, possibly on another platform entirely. EVCs all us to assess the non-click value of an ad.
To check EVC reporting within Google Ads, head to Segment > Select Conversions > Ad Event Type.
What metrics should I choose to report upper funnel?
In an ideal world, you will want to choose a variety of everything we have outlined above. Having a blended ROAS figure will appease all the financially minded in the business, but softer engagement led KPIs can be a great signpost as to the effectiveness of your creative and your targeting.
Look at measuring as much as you can and then reviewing which metrics are becoming the guiding light in your decision making and focus down on these. You don’t want to be drowning in data.